By: Steve Bilow, Senior Product Marketing Manager
Since its introduction, we’ve been telling you that the new SPG9000 API is intuitive for virtually any modern programmer and we’d like to demonstrate that.
A Personal Note on how the SPG API is Intuitive
At Telestream, we rarely write blog posts in the first person but, for a moment I’m going to buck the trend. This is so that you understand the significance of my experience. I am not a programmer. I am a product marketing manager with average knowledge of Python, at best. Yet, because I have queried REST-style HTTP endpoints with Python libraries in the past, I was able to work with the API simply by looking at the documentation. With that, I’ll stop talking about me and go back to what’s really important: your success.
The SPG9000 API is Familiar
The premise here is that anyone who has written code to address HTTP endpoints can write for the SPG9000 because it has a familiar, stylistically standard API. Let’s have a look.
Finding SPG9000 API Documentation
When you log into an SPG9000 you will see a user interface similar to earlier products but with several new features. We will not cover those here. What is important is that you will find a link to the API documentation in the upper right corner.

Clicking that link will take you to the API documentation where you will find such things as the possible PTP endpoints and the GET and PUT calls available.

You can see the available data by clicking one level deeper.

A few things should look very familiar. First, note that the path looks like a standard HTTP REST-style endpoint. Second, note that the data structure is JSON. Those are good indications that, if you have ever written code – whether, Java, Scala, C++, other languages, or, in our case, Python – to read and write JSON using HTTP, you will understand how to use this API immediately.
JSON from an HTTP Endpoint is Exactly What You Expect
So let’s see how the SPG9000 API is intuitive and easy to use by examining what a marketing guy can accomplish in the span of a few lines of very simple code. We will use the Python “requests” and “json” libraries and we’ll plot some graphs with matplotlib.pyplot. You have likely done this before.
A Useful Use Case
Consider a use case where you are building a dashboard and wish to plot a graph displaying how far your PTP timing deviates from the leader you are following. To make this example overly simple we will create a single static chart rather than a continuously updating one. But, you’ll get the point.
A Simple Python Example
We begin by importing the libraries we’ll need.
import requests
import json
import matplotlib.pyplot as plt
Then we will initialize 3 lists to hold the data we’ll be collecting to plot.
offsetFromMaster = []
meanDelay = []
counter = []
We next designate the URL for the dataset as the endpoint to query.
response_URL= “http://:8080/api/v1.0/ptp/1/current-ds”
And, a simple for-loop iteratively requests the JSON response from the endpoint and populates the lists.
for i in range(0, 50):
….counter.append(i)
… result = requests.get(response_URL, headers={“X-API-Key”:””}).json()
….offsetFromMaster.append(result[‘offset-from-master’])
,,,,.meanDelay.append(result[‘mean-delay’])
….. i += 1
Everything that follows does nothing more than plot the graphs. The real work is already done.
#Create a figure to display the plots
fig, axs = plt.subplots(2, 2, figsize=(14, 11))
fig.suptitle(‘PTP Statistics’, fontsize=20)
#Plot the offset
axs[0,0].plot(counter, offsetFromMaster, ‘r’)
axs[0,0].set_title(‘Offset from Master’)
#Plot the delay
axs[0,1].plot(counter, meanDelay, ‘r’)
axs[0,1].set_title(‘Mean Delay’)
#Plot a histogram of the offset
axs[1,0].hist(offsetFromMaster, bins = 10)
axs[1,0].set_title(‘Offset Distribution’)
#Plot a histogram of the delay
axs[1,1].hist(meanDelay, bins = 10)
axs[1,1].set_title(‘Delay Distribution’)
#Display the plots
plt.show()
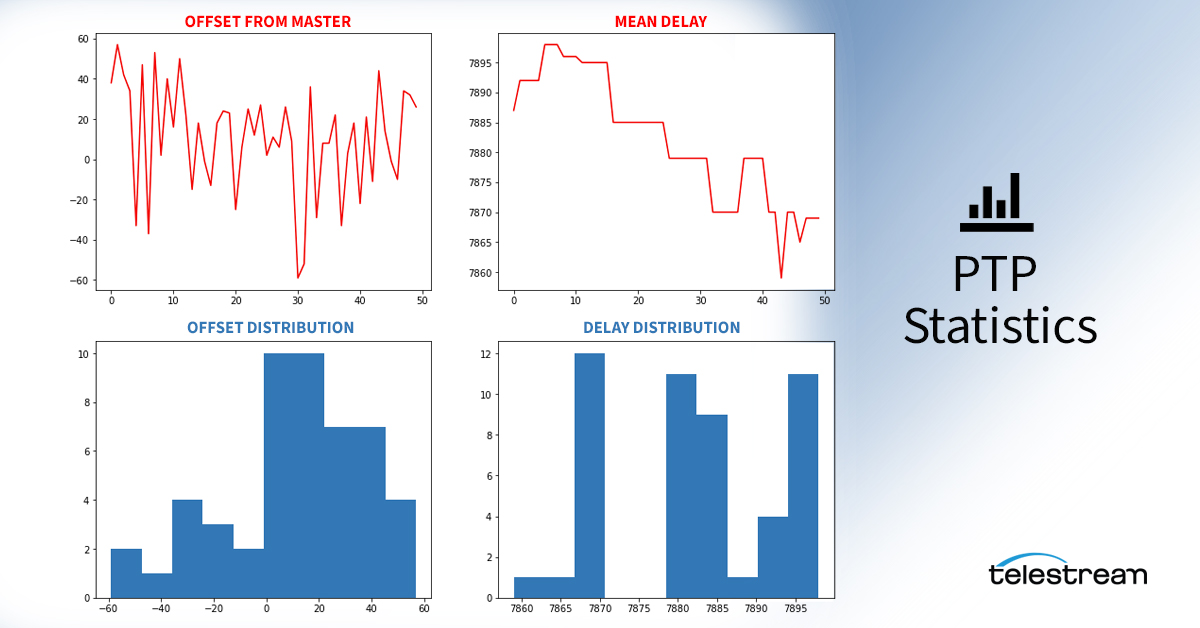
The Resulting Graphs
When you execute this program in a Jupiter notebook or an IDE, the following graphs will display.

You could obviously create anything you want. This is just a trivial example. You could also, in a complete program, run this query iteratively, updating the plots each time.
Sophistication Can Be Simple
We hope it’s clear that the new SPG9000 API is intuitive enough that anyone with a bit of modern coding knowledge to use and deploy. This is one reason that the product is easy to integrate into a sophisticated system. Of course, you need never write software to make the SPG9000 meet all of your timing and synchronization needs. This is simply one more way that the product exceeds expectations.
It’s Time to Learn More
If you have followed our posts regarding IP video diagnostics then you may recall that we’ve written more than once about diagnosing timing issues in these networks. Now that you know how intuitive the SPG9000 is, you may also be interested in those past posts about the power of PRISM to isolate and resolve stream timing issues. Check out this link.
To learn more about the SPG9000, click below.