Delays, Paths, and Order
In an IP network with many devices, every packet can take a different path from source to destination. That means that the arrival times of 2 consecutive packets are not deterministic. Another cause of unpredictability is congestion within a switch or anywhere along a path that delays a packet’s ultimate arrival. These delays cause packets to get to a destination device in a different order than they were sent. They also cause excessive latency or its inverse, burstiness. ST2110-21 provides a Virtual Reciever Model which we discuss in the paper you can get using the link below. In this post, we will provide a glimpse into using PIT Histograms to Diagnose Timing.
All of this ties directly back to our previous discussion of jitter. Recall that jitter is an aberration in packet arrival periodicity at a receiving device. Latency and burstiness are the cause of the jitter we need to eliminate. We can locate these anomalies and determine their most effective resolution using a Waveform Monitor like PRISM.
Why We Need PIT Histograms to Diagnose Timing When Measuring Jitter in RTP Networks
In a network that is carrying constant bitrate data, jitter is the amount of aperiodicity at a receiver. When you have an accurate clock in the receiver, you can evaluate jitter by measuring the timestamps of each packet as it arrives and then plotting the inter-arrival intervals versus time. This is useful to see how jitter varies over time.
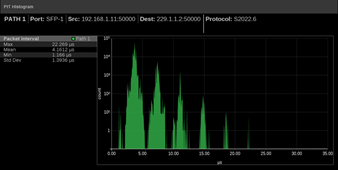
Even more useful is to plot a histogram of the distribution of packet inter-arrival intervals versus their frequency of occurrence.

If jitter is severe enough that it causes packets to be received beyond the capacity of a de-jitter buffer, the receiver will drop the out-of-range packets. We can identify packet loss patterns, and thus determine potential causes of jitter, by identifying outliers.
Using PIT Histograms to Diagnose Timing alongside PIT Graph Displays
The variations in packet interval arrival time and the temporal distribution of packets produce a characteristic signature for a device. If you connect a Telestream PRISM directly to a Sender’s output you won’t introduce variations across the network and you can see how packets are sent out of the device. This tells you nothing about the network. But it does tell you quite a bit about other causes of indeterminacy like buss performance and drive access speed. That’s why any given device will have a recognizable PIT Histogram signature when directly connected to PRISM.

Knowing the network independent characteristics of the device we can identify network issues based on deviation from this baseline. The PIT Histogram will commonly change when a stream is passed through a series of switches. That’s because it is now dependent on network traffic. Because we can easily see this change, we can use a PIT Histogram to diagnose issues with a stream.

Now you have a little insight into what a PIT Histogram is and how it can be used to characterize a device and that device’s performance in a given IP environment. This is, intentionally, just a taste. That’s because we have a superb whitepaper that describes this in much greater detail and we want you to have it. So, instead of reading a long blog post simply click the link below, grab the whitepaper, and take a deep dive into the fascinating world of IP video diagnostics and the power of PRISM to help enable them.
Click here to get our comprehensive technical guide to diagnosing IP media networks.
To learn more about the PRISM software-defined waveform monitor platform and the complete family of solutions click here.
If you missed the first in this series of posts, click here to read it.