The introduction of High Dynamic Range (HDR) and Wide Color Gamut (WCG) technologies has advanced video production but also brought unique challenges across the video workflow—from live production to post-production. A critical issue arises during simultaneous HDR and Standard Dynamic Range (SDR) productions, where maintaining consistent quality for both HDR and SDR audiences requires meticulous monitoring. Without careful attention, details and colors in the so-called ‘HDR zone’—such as luminance levels exceeding 203 nits or hues outside the ITU BT.709 gamut—can become suppressed or modified to an unacceptable extent during SDR conversion. We will examine how advanced live monitoring tools introducing luminance qualification for generating CIE chromaticity charts can assist production teams by isolating colors in specific luminance ranges, enabling precise camera adjustments and avoiding excessive excursions.
Color Bleed Challenges in High and Low Luminance Ranges
Dealing with color bleeds in post is a uniquely challenging task. A good example is the problem of isolating color bleeds in high luminance areas in the image, such as tungsten filaments from aging light fixtures on bright white shirts. Typically, colorists would use a combination of picture displays, vectorscopes and waveform displays to attempt to isolate and then fix the colors. Similar problems arise for color bleeds in the low luminance regions.
Accelerating Color Isolation Within Luminance Zones With LQCIE
To address the above need and in general to speed up isolating colors within specific luminance zones, Telestream is introducing luminance qualification for the CIE chromaticity chart – Luminance Qualified CIE or LQCIE. The CIE chromaticity chart is an excellent, but currently underutilized, tool for visualizing image chromaticity in a 2D display. A typical CIE chromaticity chart with the Rec. ITU-BT 709, Rec. ITU-BT 2020 and DCI-P3 gamut triangle boundaries is shown below.
CIE Chromaticity Chart
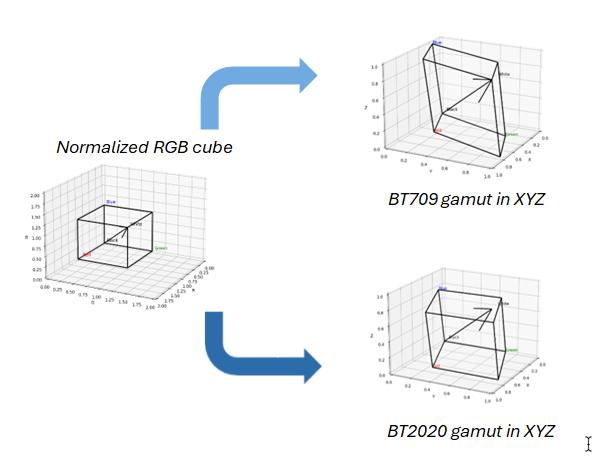
The origins of the CIE chromaticity chart can be summed up by the following figures. We have a normalized RGB cube that is mapped into the device independent XYZ space using either the Rec. ITU-BT 709 or Rec. ITU-BT 2020, for example.
Mapping of RGB cube to ITU-R BT.709 and ITU-R BT.2020 gamuts
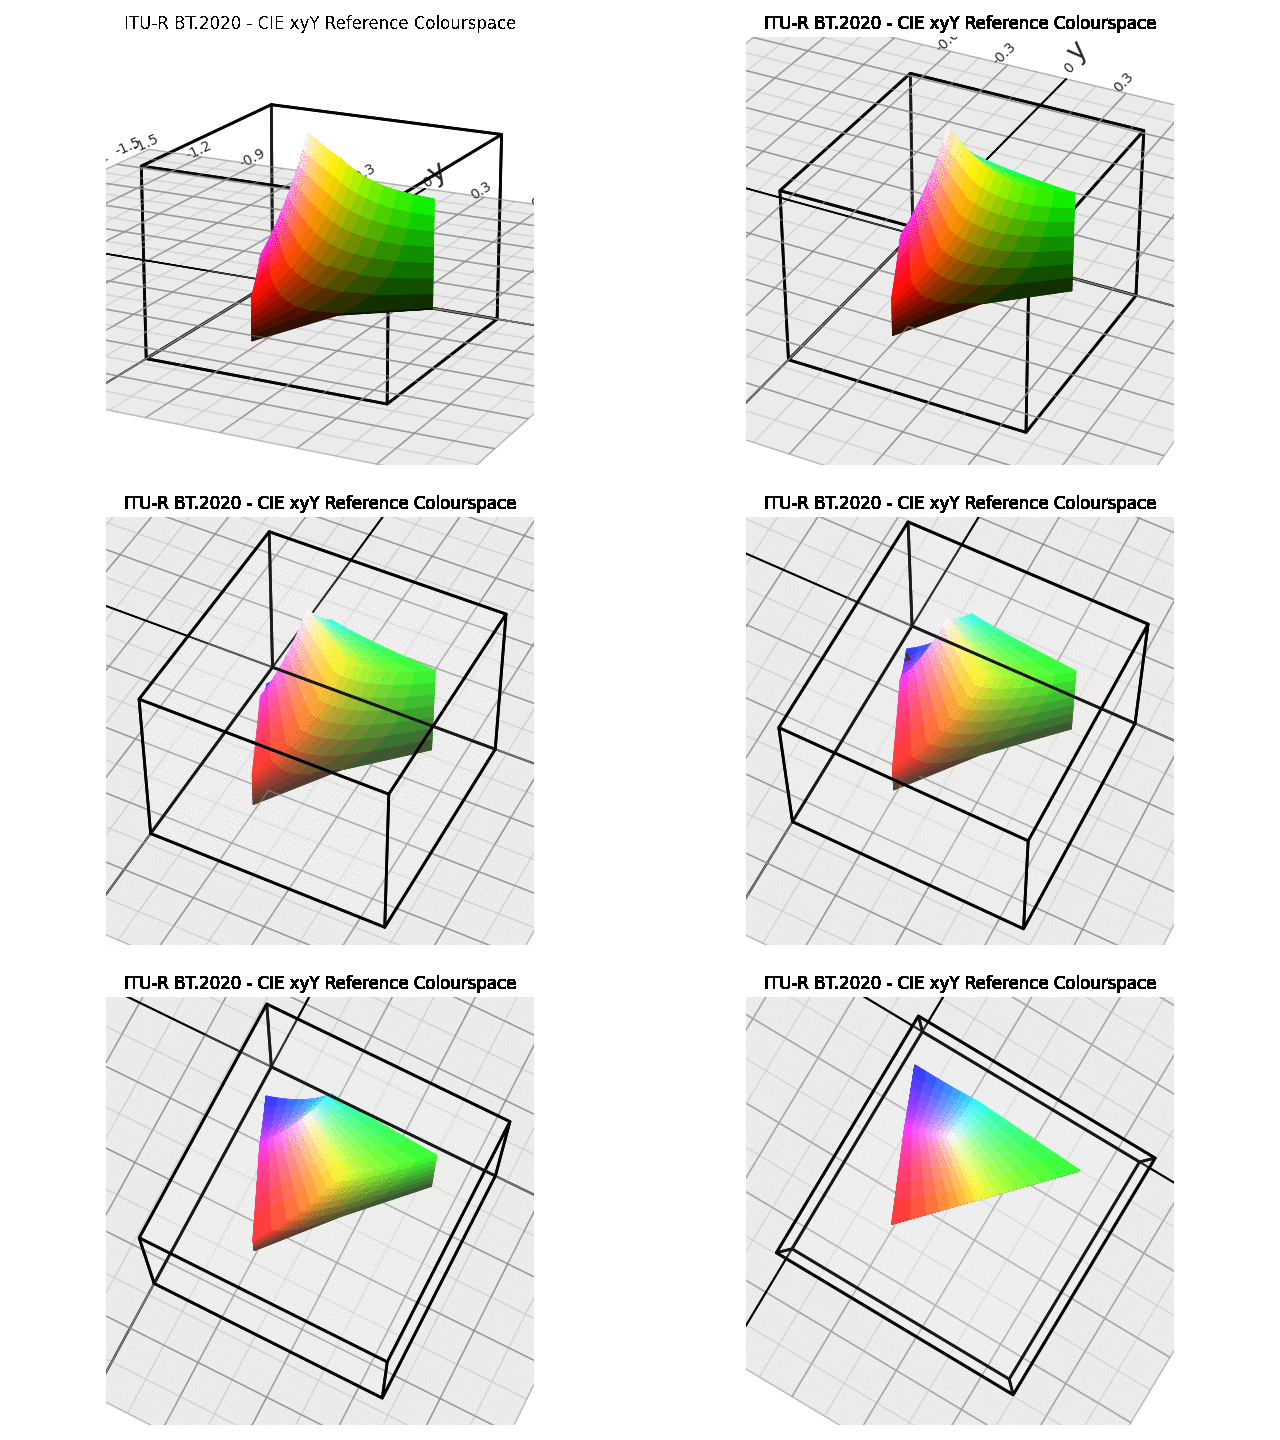
Unfortunately, the XYZ space does not separate chromaticity from luminance very well (which is needed to study the distribution of chromaticity against luminance). The xyY color space on the other hand performs a better job of separating chromaticity from luminance. The ITU-BT.2020 volume in XYZ in the above figure maps to a color volume in xyY space as shown in the figure below.
Color volume for RGB cube in xyY
This color volume has Y or luminance along the z axis. Projecting this color volume along the luminance axis results in a 2D plot of (x,y) which represents the chromaticity values for all the pixels in a given image.
Projection of xyY into xy
If we pause the above animation when the z axis (for luminance) is completely orthogonal to the viewing screen, we realize that the 2D projection is simply the gamut triangle (for Rec. ITU-BT 2020) in the CIE chromaticity chart.
The ITU-R BT.2020 gamut triangle
To recap, in order to generate the CIE chromaticity chart, we projected the entire luminance axis down into the 2D (x,y) chromaticity plane. Limiting the projection to certain specific ranges or zones of the luminance axis will quality the CIE chart against luminance. Hence the term Luminance Qualified CIE or LQCIE.
The advantage with qualifying the CIE against luminance is that it allows the generation of the CIE chromaticity chart only for specific luminance zones of interest, thus helping with speedy isolation of color bleeds or in general to focus work only in those specific luminance zones.
LQCIE Provides Extensive Control Over Luminance Ranges
The Telestream LQCIE controls in PRISM waveform monitors allow the user to set the luminance ranges in %IRE, code values or nits, thus providing a great degree of user control. The following examples indicate how LQCIE can be used to focus in on specific zones. The figure below shows an example image and it’s corresponding CIE chromaticity chart.
Test image and corresponding CIE chart
Assuming that we are working with SMPTE 2084 PQ in ITU-R BT.2020 gamut, the following image shows the CIE chart’s luminance range constrained between 203 and 10000 nits. The image on the right is the picture constrained between the same luminance range. This shows the pixels within that luminance range that contributes to the CIE chart.
Luminance constrained between 203 and 10000 nits
Another example with the luminance range constrained between 1000 and 10000 nits.
Luminance constrained between 1000 and 10000 nits
In conclusion, the Telestream LQCIE offers users fine – control over the CIE chromaticity chart, thus helping to isolate specific colors to increase efficiency and accuracy in HDR/WCG workflows.
Learn More About Telestream PRISM Monitors
PRISM waveform monitors support SDI, IP, and hybrid SDI and IP workflows. They offer extensive tools for managing all high-quality content and are customizable with an extensive library of software application options. Backed by 75 years of experience, PRISM is a part of Telestream’s Test & Measurement monitoring and sync generation solutions.
To learn more about our Test & Measurement solutions including PRISM waveform monitors, visit our page.


